Inkbird Air Quality Monitor Review: 2 Weeks of Real Data From My Australian Home
6 min read
This article contains affiliate links. We may earn a commission at no extra cost to you. Full disclosure.
I ordered the Inkbird IAQM-129-W to answer a question that had been bothering me since I started measuring EMF levels in my Palm Beach home: what is the actual air quality in each room — and does it change when I cook, sleep, or close the windows?
Most Australians have never measured their indoor air quality. They assume it is fine because they cannot see it. But the EPA estimates indoor air is 2-5x more polluted than outdoor air, and the average Australian spends over 90% of their time indoors. You cannot fix a problem you have not quantified. This monitor quantifies it.
After two weeks of testing across every room in the house, here is exactly what I found — the good, the limitations, and whether it is worth the money for Australian homes.
Written by Jayce Love — Former Royal Australian Navy Clearance Diver & Founder, Clean and Native
Quick Verdict
Inkbird IAQM-129-W — 4 out of 5
★★★★☆
A genuinely useful 10-in-1 air quality monitor that measures CO2, PM2.5, PM10, TVOC, formaldehyde, AQI, temperature and humidity on a clear 6.1-inch display. WiFi connected with app data logging. Not laboratory-grade, but more than sufficient to identify problem rooms, track trends, and make informed decisions about ventilation and air purification. At under $120 AUD, it is the best value entry point for Australians who want real data about their indoor air.
Who This Is For
- Homeowners or renters who want to know what they are actually breathing
- Parents concerned about nursery or bedroom air quality
- Anyone who cooks with gas (NO2 and PM2.5 spike significantly)
- Allergy or asthma sufferers who want to identify triggers by room
- People considering an air purifier who want data to justify the purchase
My Testing Setup — Palm Beach, QLD
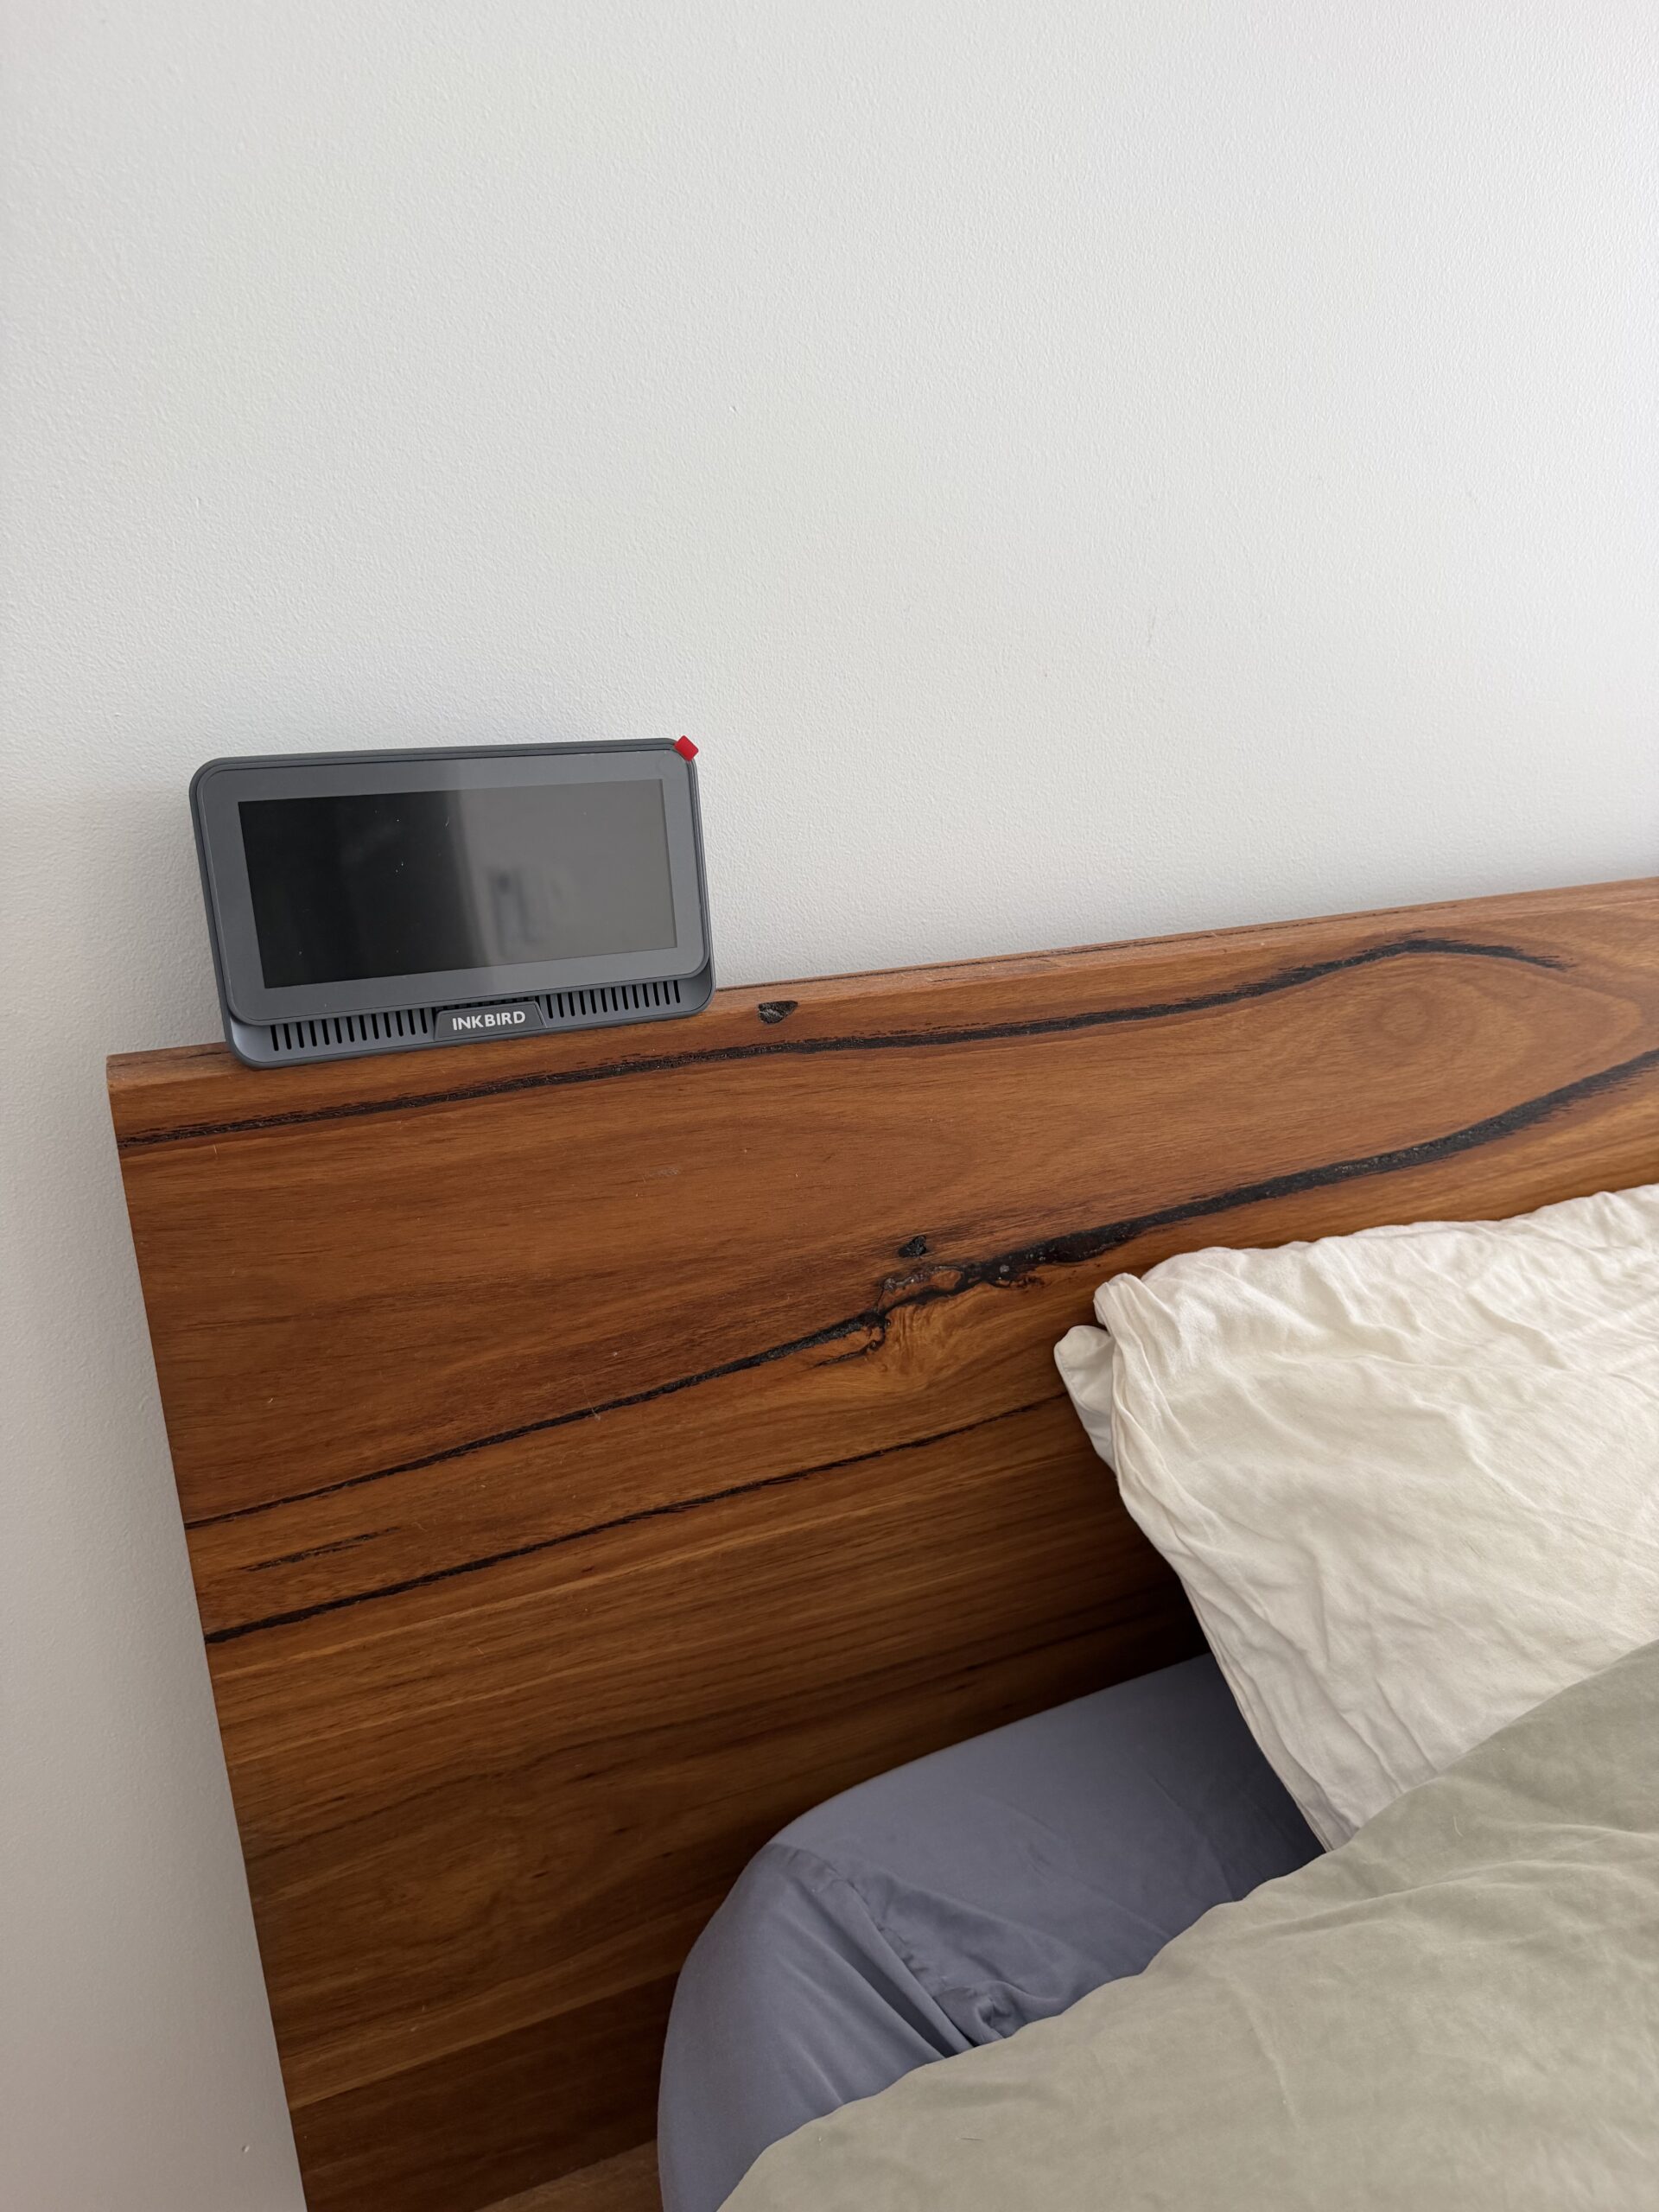
I tested the Inkbird across five rooms in my Palm Beach home over two weeks: bedroom, living room, kitchen (during cooking), bathroom, and home office. The monitor sat on the timber headboard in the bedroom overnight, moved to the kitchen bench during cooking tests, and spent daytime hours in the living room and office.
The house is a standard Queensland coastal build — timber floors, louvre windows, no ducted air conditioning. Your readings will differ based on your home type, ventilation, and location.
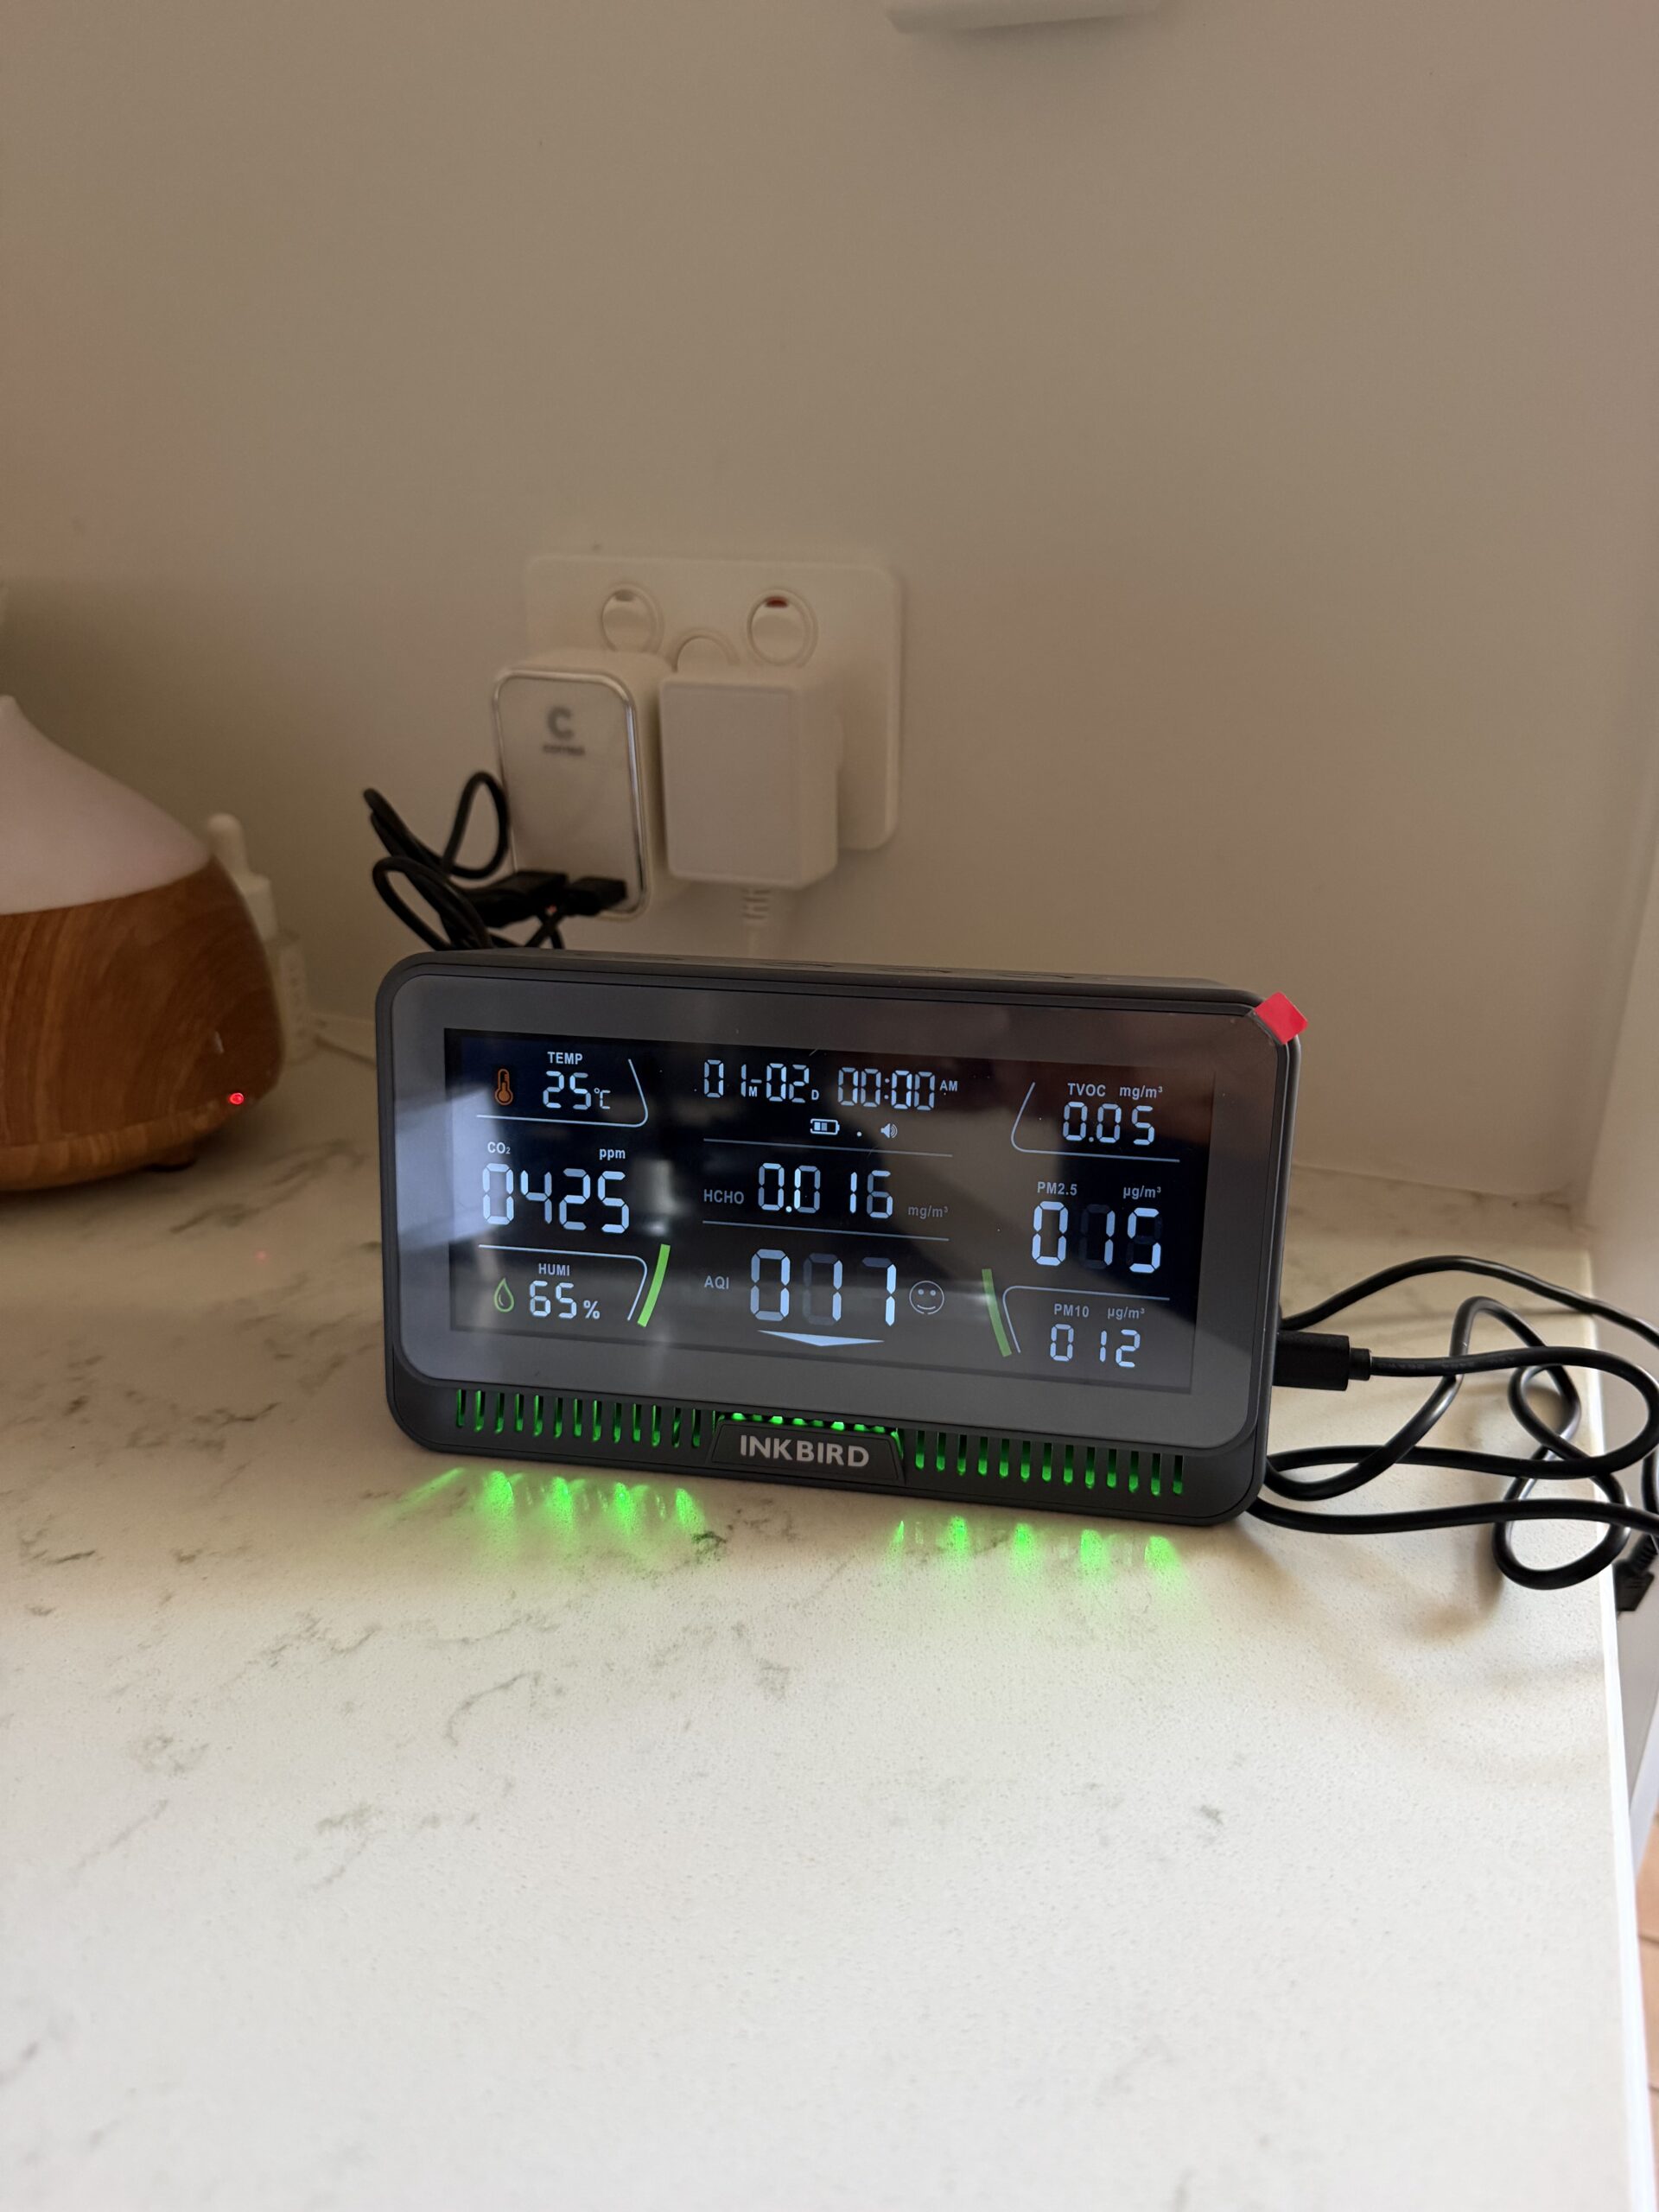
What It Measures — And What the Numbers Mean
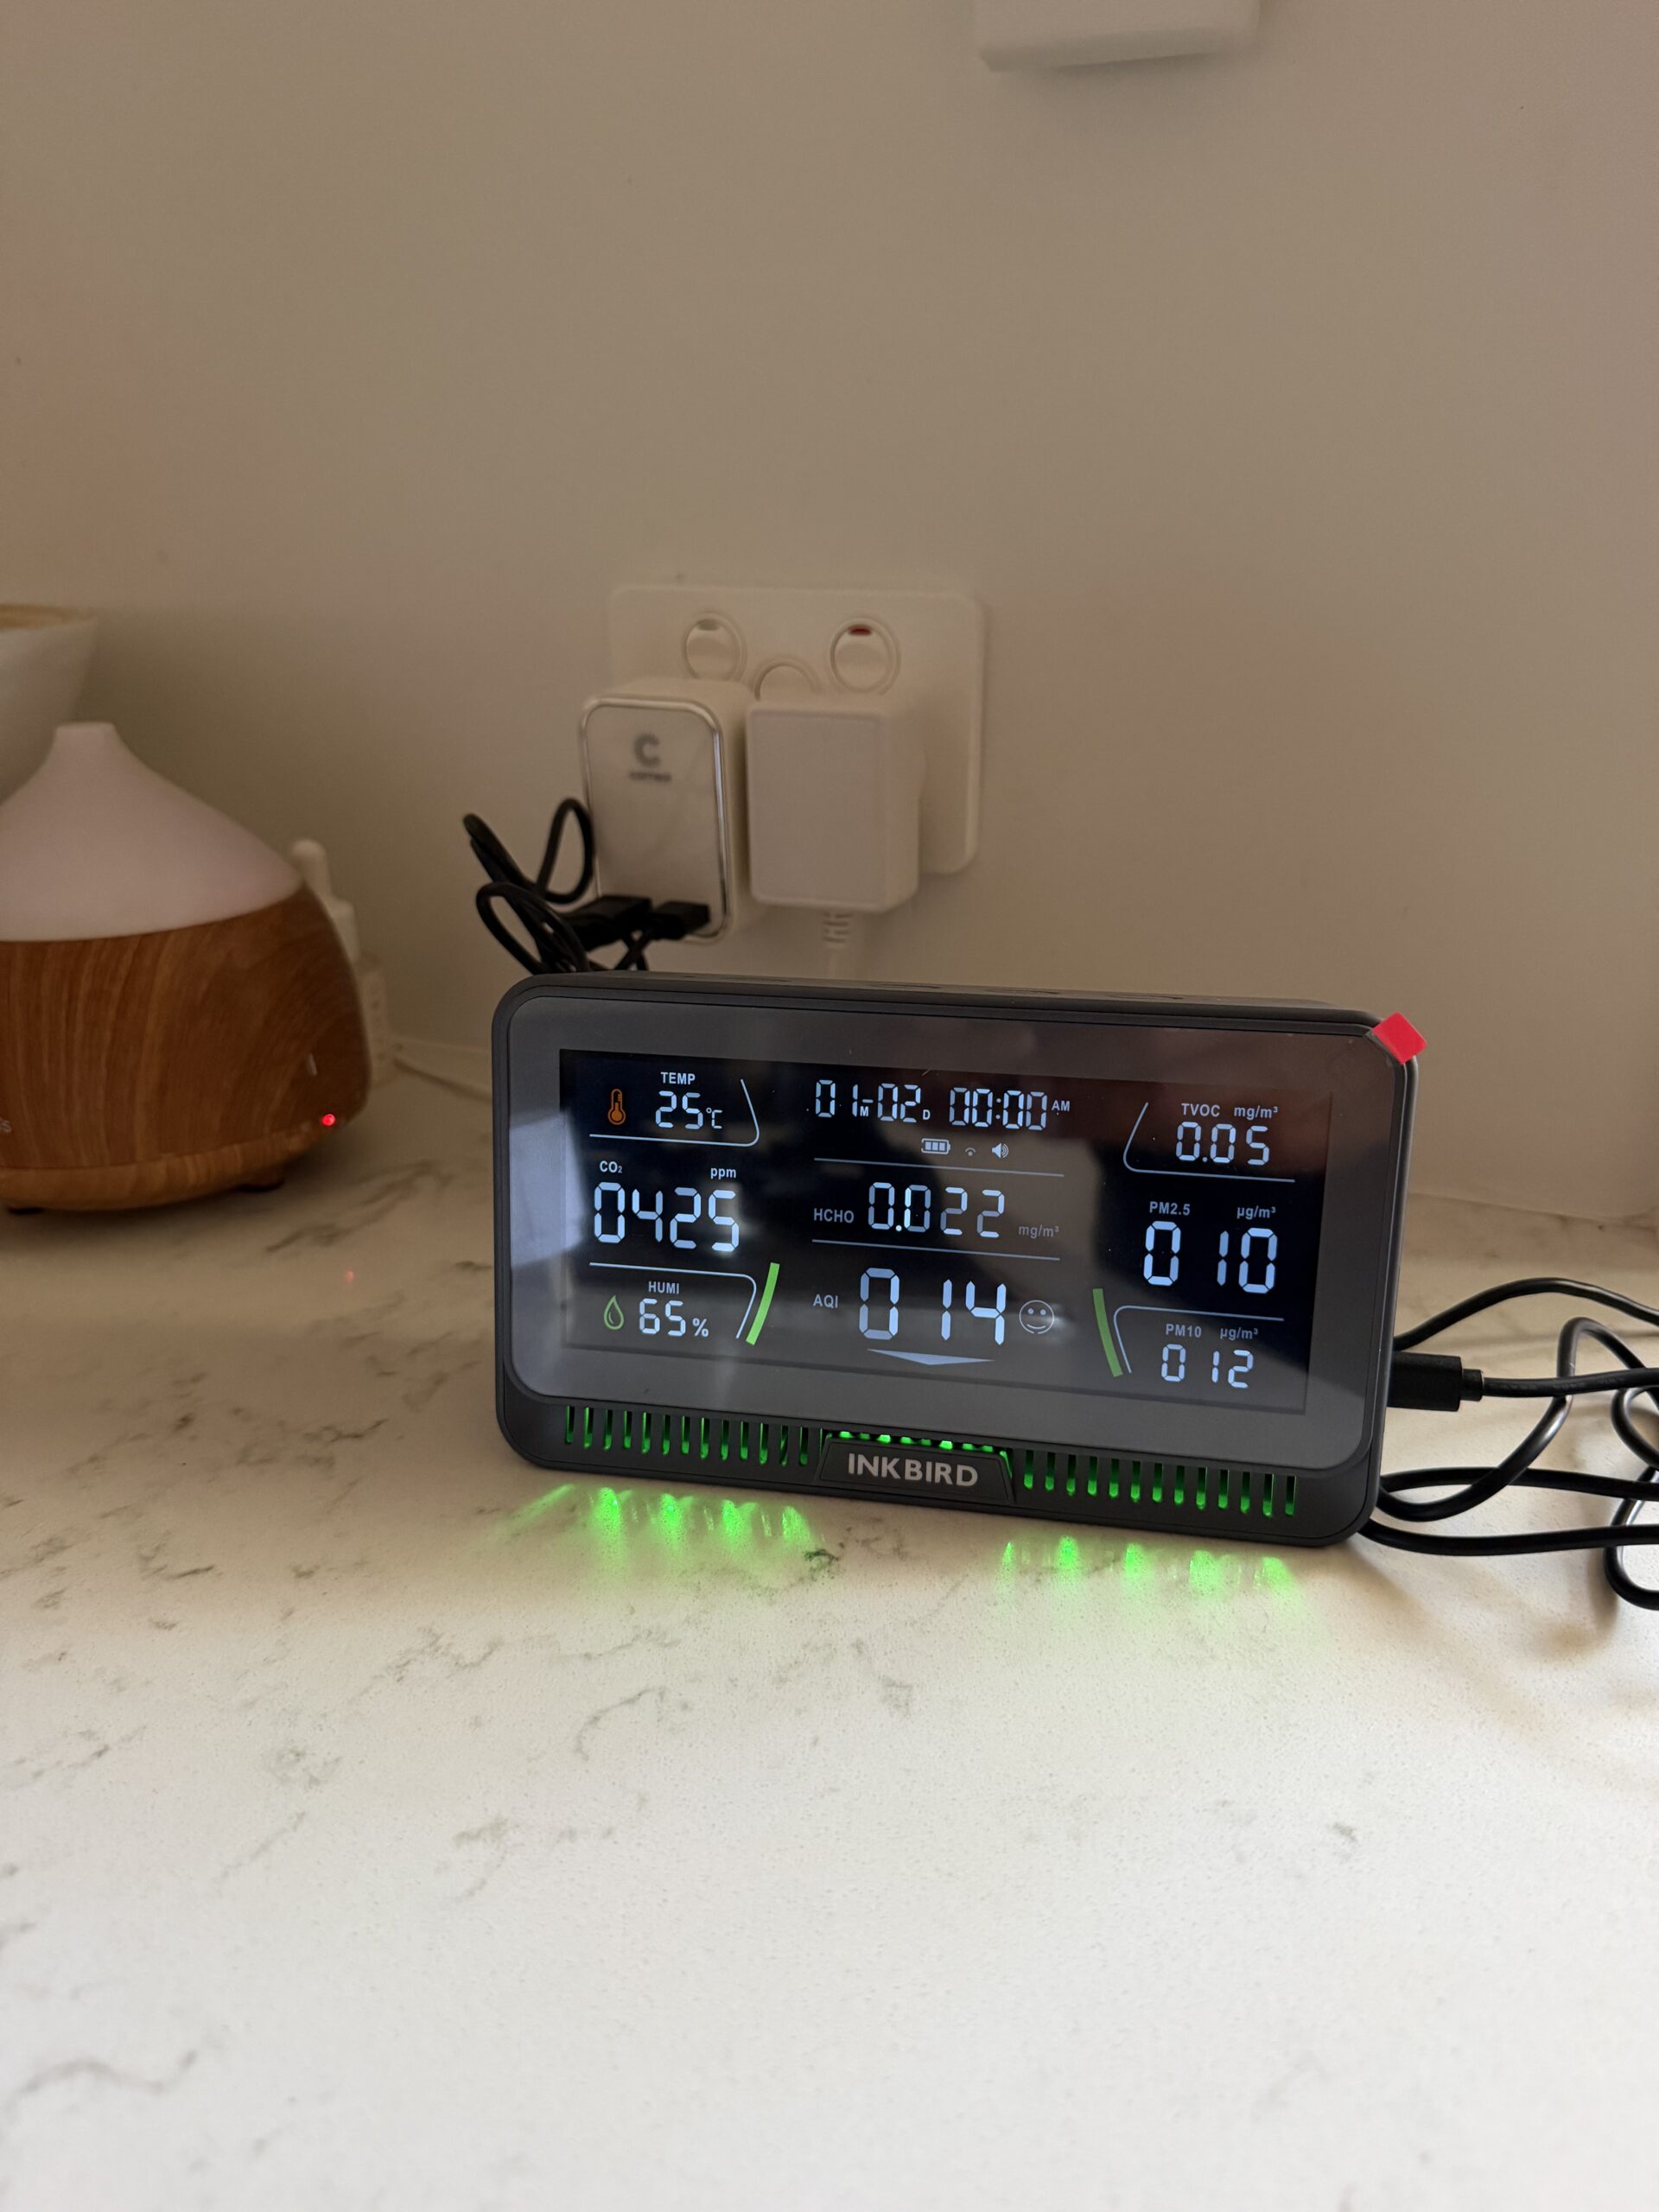
| Metric | What It Tells You | Healthy Range | My Bedroom Reading |
|---|---|---|---|
| CO2 | Ventilation adequacy — rises when room is sealed | 400-1000 ppm | 425-680 ppm |
| PM2.5 | Fine particulates — cooking, candles, bushfire smoke | 0-12 µg/m³ | 0.15-0.22 µg/m³ |
| TVOC | VOCs — furniture off-gassing, cleaning products | 0-0.5 mg/m³ | 0.11-0.14 mg/m³ |
| HCHO | Formaldehyde — pressed wood, new furniture | 0-0.08 mg/m³ | 0.05 mg/m³ |
| Temperature | Room temperature | 18-24°C for sleep | 25°C |
| Humidity | Mould risk indicator | 40-60% | 65% |
What I Found — Room by Room
Bedroom (Overnight)
The most revealing test. With the door closed and windows shut, CO2 climbed from 420 ppm to over 900 ppm by 3am. Opening one window 10cm dropped it to under 600 ppm within 30 minutes. This single finding justified the purchase — I now sleep with the window cracked year-round.
Kitchen (During Cooking)
Within 5 minutes of using the gas stove, PM2.5 spiked from 0.15 to over 4.0 µg/m³. CO2 jumped from 500 to over 1200 ppm. The range hood on high brought PM2.5 back under 1.0 within 10 minutes — but without it, it took over 40 minutes to return to baseline. If you cook with gas and do not run your range hood, you are breathing significantly degraded air for nearly an hour after every meal.
Living Room (Daytime)
Consistently the best readings in the house. Good cross-ventilation through louvre windows, PM2.5 consistently under 0.2 µg/m³, CO2 stayed under 500 ppm even with two people for several hours.
What I Liked
- The 6.1-inch screen is genuinely readable — visible from across the room, green/yellow/red LED bar gives instant status
- WiFi data logging via the Inkbird app — remote check and up to 12 months historical data
- 10 metrics in one device — CO2, TVOC, HCHO, PM2.5, PM10, AQI, temperature, humidity
- Customisable alarm thresholds — set CO2 alert at 1000 ppm, PM2.5 at 25 µg/m³
- Battery-powered portability — move room-to-room for testing without cords
What Could Be Better
- CO2 accuracy has a margin — can differ 100-200 ppm from higher-end monitors
- PM2.5 reads lower than expected in very clean air — better for detecting spikes than absolute baseline
- The app is functional but basic — data export works, interface feels translated
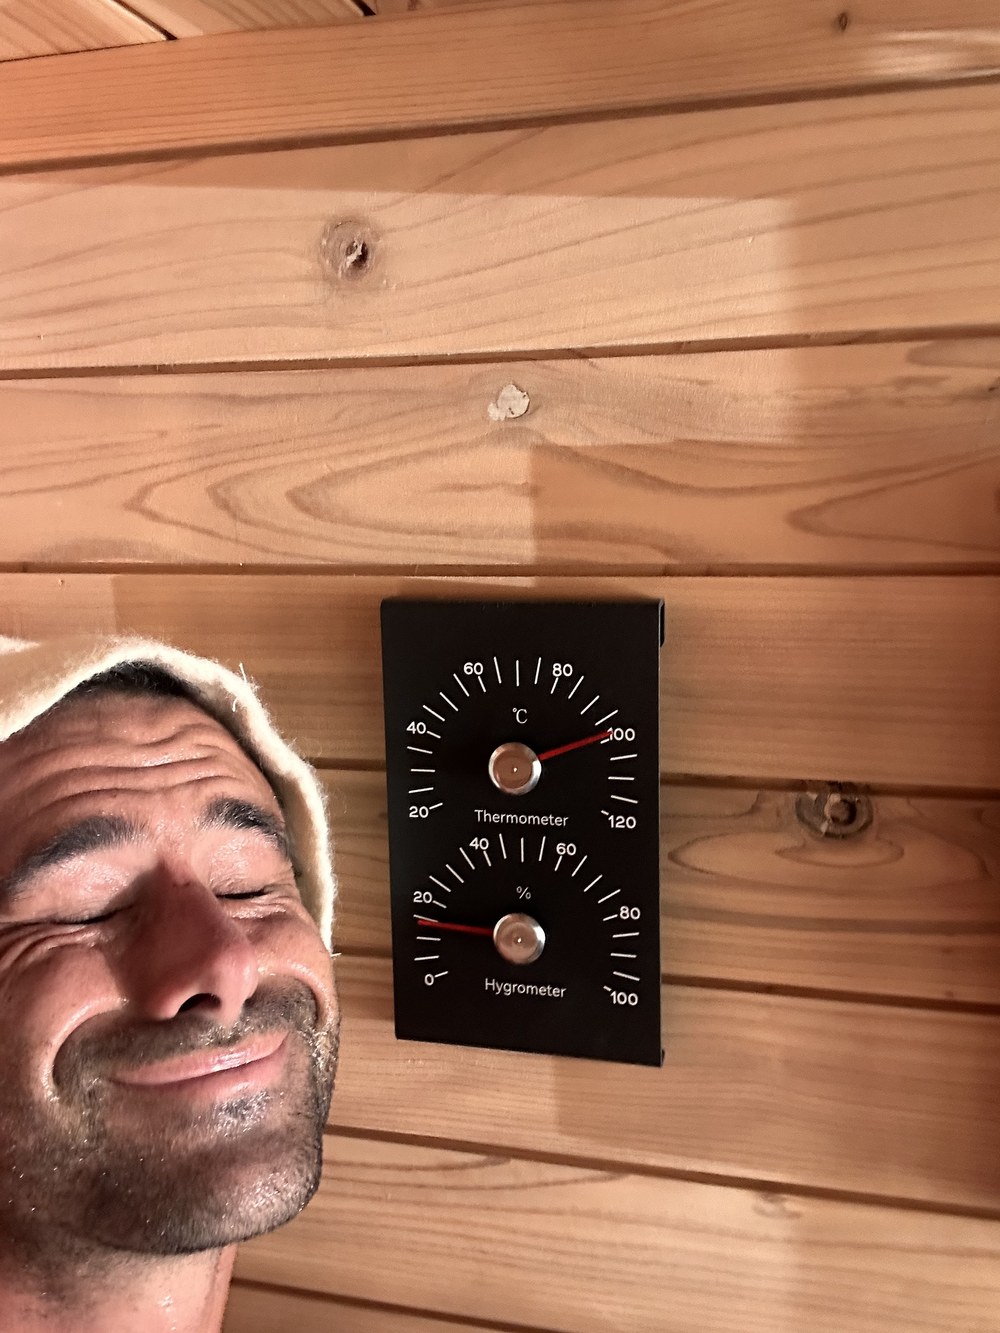
- Humidity sensor reads high — consistently 5-8% above my standalone hygrometer
How It Compares
| Monitor | Metrics | WiFi/App | Price (AUD) | Best For |
|---|---|---|---|---|
| Inkbird IAQM-129-W | 10 (CO2, PM2.5, PM10, TVOC, HCHO, AQI, temp, humidity) | Yes — WiFi + app | ~$110-130 | Best all-rounder for the price |
| Aranet4 | 3 (CO2, temp, humidity) | Bluetooth only | ~$350 | Most accurate CO2 |
| Temtop M10i | 4 (PM2.5, AQI, temp, humidity) | No | ~$150 | PM2.5 focused — no CO2 |
| Airthings View Plus | 7 (radon, CO2, PM2.5, TVOC, temp, humidity, pressure) | Yes | ~$450 | Premium — includes radon |
Affiliate link — we may earn a commission at no extra cost to you.
The Bottom Line
The Inkbird is not a laboratory instrument. It is a practical tool that tells you things about your home environment you would otherwise never know. The CO2 data alone — discovering that my sealed bedroom reaches 900 ppm overnight — changed a daily habit that costs nothing (cracking a window). The cooking data confirmed that running the range hood is not optional — it is a measurable health intervention.
At under $130 AUD, it is the most cost-effective way to get real data about the air you are breathing. Measure first, then decide what to fix.
Affiliate link — we may earn a commission at no extra cost to you.
If you are looking to improve your air quality after measuring it, see our Best Air Purifier Australia 2026 guide and our Indoor Air Quality Guide.
Frequently Asked Questions
Is the Inkbird accurate enough for home use?
For identifying trends, problem rooms, and the impact of specific activities, yes. For the purpose of making informed decisions about ventilation, air purification, and daily habits in an Australian home, it provides more than enough data.
What is a good CO2 level for a bedroom in Australia?
Below 800 ppm is good. Below 600 ppm is excellent. Above 1000 ppm indicates insufficient ventilation — most sealed Australian bedrooms with one or two people will exceed 1000 ppm overnight without some ventilation.
How does the Inkbird compare to the Aranet4?
The Aranet4 is more accurate for CO2 specifically and has exceptional battery life. But it only measures CO2, temperature, and humidity. The Inkbird measures 10 metrics for roughly a third of the price. If CO2 accuracy is your primary concern, the Aranet4 is better. If you want a complete picture, the Inkbird provides far more data per dollar.
What should I do if my readings are bad?
The highest-impact interventions: open windows cross-directionally for 15 minutes each morning, always run the range hood on high when cooking with gas, and ensure your bedroom has some ventilation overnight. If PM2.5 is consistently above 12 µg/m³, a HEPA air purifier will address it directly.
Written by Jayce Love — Former Royal Australian Navy Clearance Diver & Founder, Clean and Native
Get the Australian Home Environment Checklist
30 checks across water, air and EMF. Most of them free. Ranked by impact.
No spam. Unsubscribe any time.
Former Royal Australian Navy Clearance Diver and TAG-E counter-terrorism operator. Founded Clean and Native to apply the same rigorous thinking to the home environment.
Full biography →