5G EMF in Australia: What the Science Says and What to Measure
I’m a Royal Australian Navy Clearance Diver, and I researched and tested the products in this guide myself. In that role I’ve spent years working in environments where understanding what’s in the water — and the air — is non-negotiable. When 5G towers started appearing in my suburb, I applied the same approach: measure first, then decide.
5G networks in Australia operate primarily in the 3.5 GHz and 26 GHz frequency bands, producing radiofrequency electromagnetic fields regulated by ARPANSA under the Radiation Protection Standard for Maximum Exposure Levels to Radiofrequency Fields — 3 kHz to 300 GHz (2002). The public exposure limit at 3.5 GHz is 10 W/m² (1,000 µW/cm²). Measured field strengths in residential areas near 5G base stations typically fall between 0.1 and 2 V/m — well below that regulatory ceiling. The more relevant benchmark for anyone concerned about sleep or long-term exposure is the building biology sleeping area guideline of <0.1 mW/m², which is orders of magnitude stricter than the ARPANSA thermal safety limit. In this guide I walk through what 5G actually emits, how Australian infrastructure is deployed, what the research record actually shows, and — most importantly — how to measure what’s arriving at your bedroom wall.
How 5G Networks Are Deployed in Australia
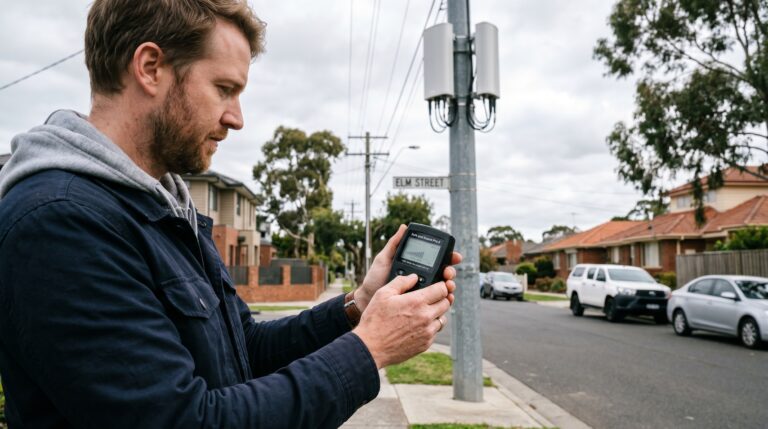
Australia’s 5G spectrum is allocated and licensed by the Australian Communications and Media Authority (ACMA). The three main carriers — Telstra, Optus, and TPG Telecom — hold licences in the 3.4–3.7 GHz band (sub-6 GHz 5G) and the 26 GHz millimetre wave (mmWave) band covering 24.7–27.5 GHz. A third band, 700 MHz, carries 5G signals in some regional deployments piggy-backing on existing LTE infrastructure.
Understanding deployment type is critical to assessing your actual exposure. There are three distinct cell types in operation:
| Cell Type | Typical Location | Max EIRP (3.5 GHz) | Effective Range |
|---|---|---|---|
| Macro cell | Tower, rooftop, hilltop | Up to 320 W EIRP | Up to 2 km |
| Small cell | Street pole, building facade | 6.3–25 W EIRP | 100–300 m |
| mmWave node | Dense CBD, stadium, transit | <10 W EIRP | <100 m (line of sight) |
EIRP figures derived from ACMA Technical Framework for 5G and ARPANSA EME assessment documents (2020–2023).
For perspective: a 4G macro cell can reach 1,280 W EIRP — roughly four times higher than a 5G macro cell at the same frequency range. 5G base stations compensate for lower broadcast power through beamforming, a phased-array technique that concentrates RF energy in a narrow beam directed at the active device rather than radiating uniformly in all directions. The practical effect is that a 5G base station produces higher instantaneous field strength in the beam direction but significantly lower ambient background RF for anyone not in the beam path. When the sector is idle, power output drops substantially.
mmWave 5G at 26 GHz is physically different. At that frequency, signals are absorbed by foliage, rain, and building materials within metres. Your internal walls, double-glazed windows, and even heavy curtains are effective attenuators. In residential settings in Australia, mmWave exposure is currently negligible outside of CBD cores in Sydney, Melbourne, and Brisbane.
The ARPANSA Standard — What It Measures and What It Doesn’t
ARPANSA’s 2002 RF standard (currently under revision in alignment with ICNIRP 2020 guidelines) sets the general public limit at 10 W/m² for frequencies in the 3–10 GHz range. That converts to 1,000 µW/cm². This is a thermal safety limit — it is the level at which absorbed RF energy causes measurable tissue heating. It does not account for long-term non-thermal biological effects, which remain an active area of scientific debate.
The ARPANSA limit is not a precautionary limit. The building biology standard (developed by the International Institute for Building Biology and Ecology, used by practitioners in Australia) for sleeping areas sets the “no concern” threshold at <0.1 mW/m² — which is 100,000 times lower than the ARPANSA ceiling. These two numbers are often conflated in public debate. They measure different things:
| Standard | Limit (3.5 GHz) | Basis | Authority |
|---|---|---|---|
| ARPANSA general public | 10 W/m² (1,000 µW/cm²) | Thermal — acute tissue heating | ARPANSA (Australian) |
| ICNIRP 2020 general public | 10 W/m² | Thermal — with 50x safety factor | International |
| Building biology — “slight concern” | 0.1–1 mW/m² | Precautionary — sleep quality, chronic exposure | IBE (used by AU practitioners) |
| Building biology — “no concern” | <0.1 mW/m² | Precautionary — sleeping area target | IBE |
Most residential measurements near Australian 5G base stations in ARPANSA’s own monitoring program record power densities between 0.001 and 0.5 mW/m² — compliant with both the regulatory standard and, in many cases, the building biology “no concern” threshold. The outliers are typically apartments at close range to rooftop small cells, or homes within 50 metres of a street pole node. Those situations warrant measurement.
What the Research Record Actually Shows
This is where systematic reading matters. I approach this the same way I approach any technical safety question — start with the quality of the evidence, not the conclusion.
Established, well-replicated findings:
- The IARC classified RF-EMF as Group 2B (possibly carcinogenic to humans) in 2011, based primarily on the Interphone study linking mobile phone use to glioma. This classification has not been upgraded to 2A or Group 1 as of 2024. Group 2B includes coffee and pickled vegetables — it indicates limited evidence, not confirmed harm.
- The NTP (National Toxicology Program, USA) rat studies (2018) found statistically significant increases in heart schwannoma at whole-body RF exposure levels 1.5–6x above the US general public limit — levels not achievable through ambient environmental RF or typical phone use with current SAR limits.
- The Ramazzini Institute (Italy, 2018) found similar heart effects in rats at much lower levels, though methodology has been criticised for non-standard exposure conditions.
- ARPANSA reviewed both studies and maintained that the existing standard is adequate for current exposure levels, noting that direct translation from rodent whole-body irradiation studies to human exposure is problematic.
5G-specific research — what exists and what doesn’t:
- There is currently no long-term (10+ year) epidemiological data on health outcomes specifically from 5G exposure. The technology has not been deployed at scale long enough for such studies to exist.
- In vitro studies at millimetre wave frequencies (24–60 GHz) have demonstrated effects on skin cells and corneal tissue at power densities well above ambient environmental levels. Penetration depth at 26 GHz is <1 mm — energy is absorbed in the outermost skin layer, not in deeper tissue.
- A 2020 systematic review published in Environmental Research (Prasad et al.) found insufficient evidence to draw conclusions on 5G health effects specifically, and called for better-designed prospective studies.
- The WHO is conducting a formal health risk assessment of RF-EMF (including 5G), with completion expected in 2024–2025. Until that assessment is published, the current ICNIRP/ARPANSA framework remains the operative standard.
Australian Smart Meters, 4G, and the Sources That Actually Matter
Before spending a dollar on 5G mitigation, you need to know what is actually generating the RF fields in your environment. In my experience measuring homes in South East Queensland, the dominant RF sources in most bedrooms are not 5G towers — they are devices inside the home. This is critical for anyone considering shielding, because the sequence must be: measure first, remove internal sources, then address external residual. If you install a shielding canopy while your router is still inside the room, you reflect that signal back and increase your exposure.
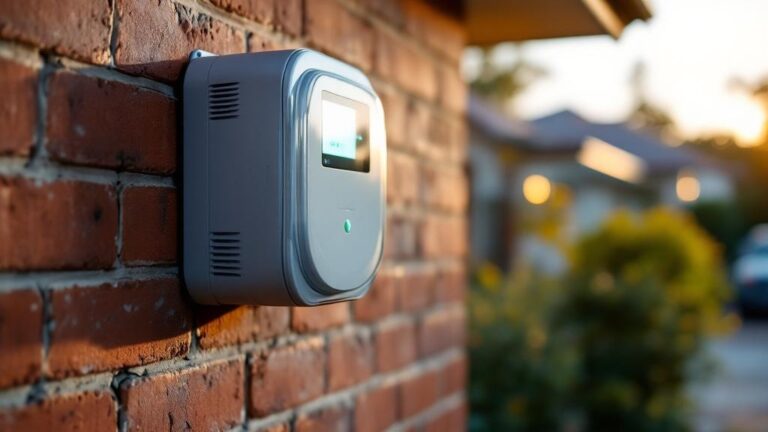
Australian smart meters operate at 900 MHz and transmit in short bursts. Peak readings during transmission can be 100–1,000 times higher than the time-averaged figure. A meter on an external bedroom wall transmitting at peak can briefly generate readings comparable to sitting next to a Wi-Fi router. The time-average is low; the peak pulse is not.
| Source | Frequency | Typical Distance | Approx. Power Density | Action Available |
|---|---|---|---|---|
| Wi-Fi router (2.4 GHz) | 2.4 / 5 GHz | Same room | 0.1–10 mW/m² | Router timer ($15, Bunnings) or hardwire |
| Smartphone (on bedside table) | 700 MHz–2.6 GHz | <1 m | 1–50 mW/m² (pulsed) | Airplane mode (free) |
| Smart meter (external wall) | 900 MHz | 0.5–3 m through wall | Peak: 10–100 mW/m² | Bed position change, shielding paint on wall |
| 5G macro tower (100 m away) | 3.5 GHz | 100+ m | 0.01–0.5 mW/m² | Measure first — may not require action |
| 5G small cell (50 m, street pole) | 3.5 GHz | 50 m | 0.1–2 mW/m² | Measure — may exceed building biology threshold |
| Neighbour’s Wi-Fi (through wall) | 2.4 / 5 GHz | 5–10 m | 0.01–1 mW/m² | Request SSID change channel; shielding if persistent |
The two free actions — router timer and phone on airplane mode at night — will eliminate the largest RF sources in most Australian bedrooms. Do those first. Measure after. Then assess whether a 5G tower is actually contributing meaningful exposure to your sleeping environment.
For low-frequency electric fields from household wiring, a demand switch (installed by a licensed electrician on your bedroom circuit, approximately $100–150) will cut AC electric fields during sleep. This is separate from RF — but often the bigger issue in older Queensland homes where unshielded wiring runs directly behind bed heads.
See our detailed guide on bedroom EMF reduction guide for the full protocol, and EMF reduction guide for hardwiring your network as a permanent RF reduction strategy.
How to Measure 5G RF Fields in Your Home
Measurement is not optional if you are going to make any informed decision about 5G exposure. Consumer-grade meters have specific limitations you need to understand before buying one.
What to Look for in an RF Meter
The critical specification is frequency range. Most consumer meters top out at 8 GHz. That covers the 3.5 GHz 5G band but does NOT cover 26 GHz mmWave 5G. For residential measurement in Australia, this is currently acceptable — mmWave is not deployed outside dense CBDs and even then penetrates almost no building material. A meter covering 100 MHz to 8 GHz will capture all relevant residential sources including 5G sub-6, 4G LTE, Wi-Fi, smart meters, and DECT phones.
The second critical specification is peak hold. Smart meters and 5G base stations transmit in bursts. A meter that only reads RMS average will dramatically underreport peak exposure. You need peak hold capability to see what your body is actually receiving during transmission events.
| Meter | Frequency Range | Peak Hold | Covers 5G Sub-6 | Price (AUD approx.) |
|---|---|---|---|---|
| Acoustimeter AM-10 | 200 MHz — 8 GHz | Yes | Yes | ~$380 |
| Cornet ED-88TPlus | 100 MHz — 8 GHz | Yes | Yes | ~$180 |
| GQ EMF-390 | 10 MHz — 8 GHz | Yes | Yes | ~$140 |
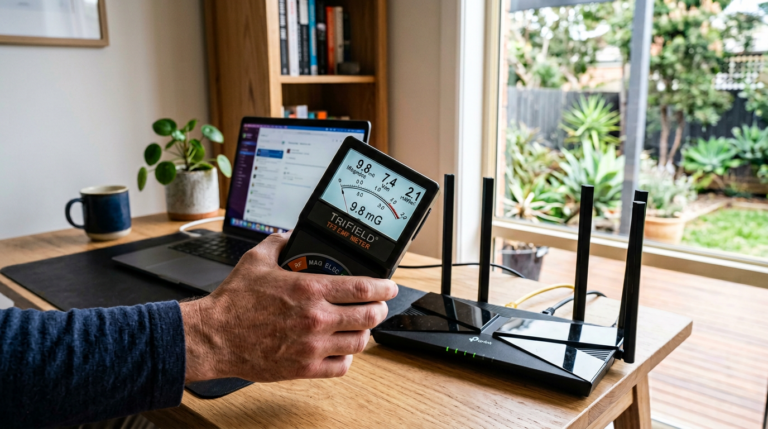
| Trifield TF2 | 20 MHz — 6 GHz | Yes | Partial (to 6 GHz) | ~$220 |
Prices are indicative. All four meters are available through Australian resellers or directly via Amazon AU. For the Cornet ED-88TPlus, see: Amazon AU — Cornet ED-88TPlus. For the Acoustimeter AM-10, check local EMF specialist suppliers as Amazon AU stock varies.
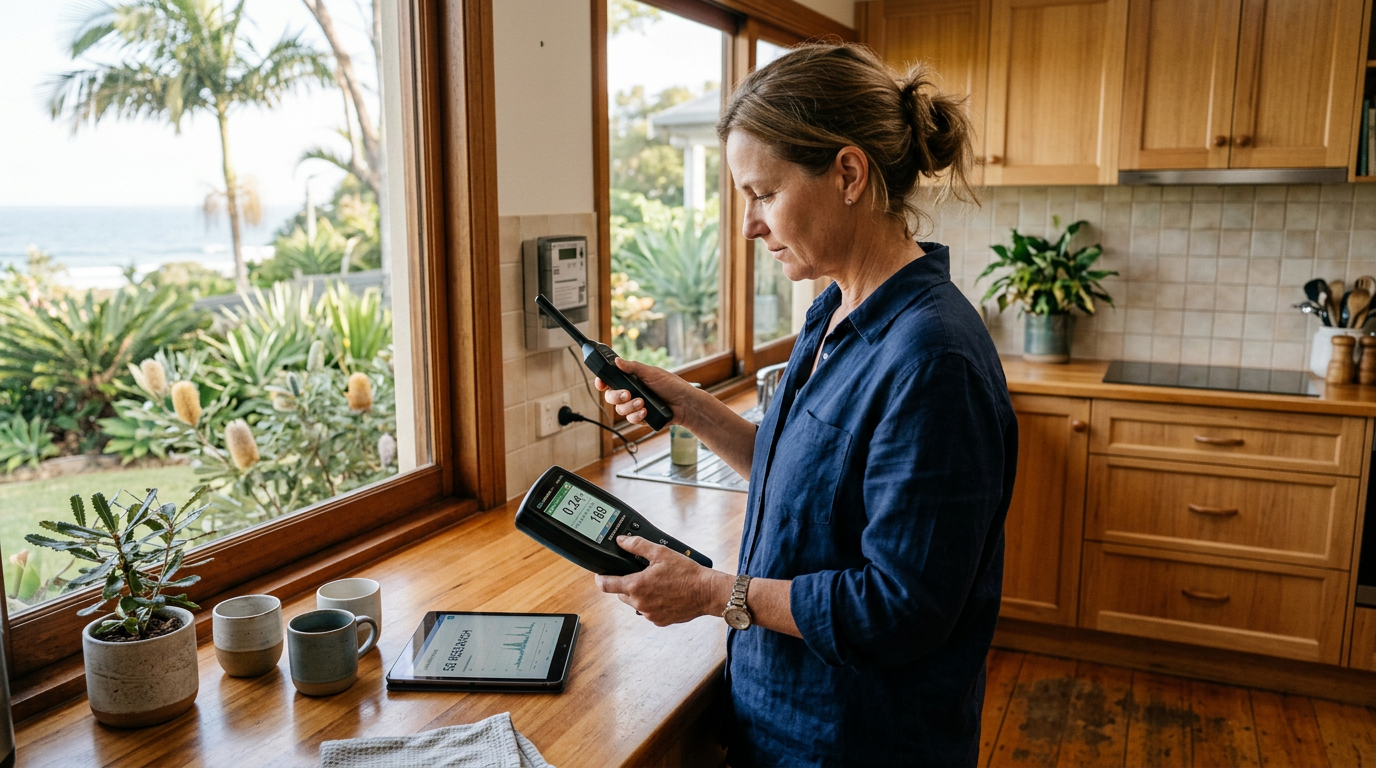
Measurement Protocol
This is the protocol I use when assessing a home. It takes roughly 45 minutes to complete properly:
- Baseline reading: Turn off all wireless devices inside the home — router, phones, smart TV, baby monitor, everything. Take readings in each room. What remains is external RF only. Note the peak hold reading and the average.
- Source identification: Turn on each internal device one at a time and note the change in reading. This tells you exactly which device is your biggest contributor.
- Sleeping position measurement: Take readings at pillow height, at 0.5 m from the wall behind the bed, and at the wall itself. External sources (towers, smart meters, neighbour’s router) show up most clearly here.
- Directional sweep: Rotate the meter in all axes at each measurement point. RF fields are directional — you can miss a signal entirely if the antenna is oriented incorrectly relative to the source.
- Time-of-day variation: 5G traffic and smart meter transmission times vary. If your baseline reading seems unusually low, repeat the measurement between 7–9 pm when network usage peaks.
Record all readings in mW/m² and compare against the building biology thresholds in the table above. Document peak and average separately. If peak readings at pillow height exceed 1 mW/m² from external sources after all internal devices are eliminated, that is a “slight concern” threshold breach under building biology guidelines and warrants further action.
Reduction Strategies — in Priority Order
The sequence matters. Do not skip steps.
Step 1: Free actions (do these tonight)
- Phone on airplane mode while sleeping. This is the single highest-impact action available to most Australians. A smartphone next to your head generates RF 100–10,000 times higher than an external 5G tower at 100 metres.
- Router timer from Bunnings (~$15). Set it to cut power to the router at your bedtime and restore it in the morning. Eliminates Wi-Fi RF from the home entirely during sleep hours.
Step 2: Low-cost hardware (<$150)
- Ethernet hardwiring: A wired connection to your primary devices eliminates the need for the router to broadcast at full strength. Pair with a router that supports wireless off mode (Asus routers have this). See EMF reduction guide.
- Demand switch: Licensed electrician installs on bedroom circuit ($100–150). Cuts AC electric fields from wiring when the circuit is idle during sleep.
- Bed repositioning: Moving a bed 2–3 metres further from a smart meter wall can reduce exposure by a factor of 4–9 (inverse square law).
Step 3: Targeted shielding (only after Steps 1 and 2 are complete)
- Shielding paint on walls facing a close-range tower or smart meter. Products like YShield HSF54 (certified to attenuate RF) can reduce transmission through a wall by 35–40 dB. Requires grounding for full effectiveness. This is a specialist job — consult a building biologist for Australian application.
- RF shielding curtains for windows facing a tower. Swiss Shield fabrics are laboratory-tested with published attenuation data. Generic “EMF curtains” from discount sites typically have no certified attenuation data — do not buy them without test reports.
- Shielding canopy for the bed: only appropriate if external RF cannot be adequately reduced by other means, all internal devices are removed from the room, and measured power density at pillow height exceeds 1 mW/m² from external sources with no other practical remedy.
For a complete product-by-product assessment of shielding materials available in Australia, see EMF shielding guide.
Our Top Picks
The TriField TF2 is the most practical EMF meter for Australian homes — measures RF, electric, and magnetic fields in one unit. If bedroom shielding is your priority, the SaferEMF canopy provides verified RF attenuation.
Get the Australian Home Environment Checklist
30 checks across water, air and EMF. Most of them free. Ranked by impact.
No spam. Unsubscribe any time.
Former Royal Australian Navy Clearance Diver and TAG-E counter-terrorism operator. Founded Clean and Native to apply the same rigorous thinking to the home environment.
Full biography →