EMF and Sleep: What the Research Shows and How to Measure Your Bedroom
Affiliate disclosure: Clean and Native earns a commission if you purchase through links on this page. This does not affect our editorial position — products are recommended based on research and testing only.
A 2024 Melbourne randomised trial showed measurable EEG sleep disruption from 2.45 GHz Wi-Fi exposure, with objective changes in slow-wave and REM architecture. Zero-cost actions like moving your router can reduce bedroom RF by 90%, but individual response varies — some sleepers show physiological changes at exposures well below regulatory limits, while others show none. The catches: you need a calibrated meter to know your actual exposure, and the evidence shows correlation, not universal causation.
| Action | Typical reduction | Verdict |
|---|---|---|
| Measure with calibrated meter | Identifies sources + baseline | Essential first step |
| Move router/modem away | 60–95% RF drop at bed | Zero-cost priority |
| Assume without measuring | Unknown exposure levels | Avoid — measure first |
Quick answer
Every product mentioned in this article has been tested using our documented methodology by Jayce Love — calibrated instruments, no gifted units, no brand payments.
The 2024 peer-reviewed evidence shows measurable EEG changes in slow-wave and REM sleep from RF-EMF exposure at Wi-Fi frequencies. A randomised crossover trial conducted in Melbourne found objective sleep disruption with 2.45 GHz exposure during sleep. The practical response is measurement before action. In this Palm Beach home, moving the router from an adjacent room to the far end of the house dropped RF at the bed head from 0.32 mW/m2 to 0.032 mW/m2 — a 90% reduction at zero cost. Whether that matters to your sleep depends on whether you are among the individuals who show physiological response. Measure first. Then decide.
If you regularly wake feeling unrested after a full night in bed, most articles will point you toward sleep hygiene, screen time, and stress. Those factors matter. But there is a variable that rarely appears in mainstream sleep advice: the radiofrequency electromagnetic field environment of your bedroom. This article covers what the 2024 research actually shows — not the overclaiming wellness sites, not the dismissive “nothing to see here” position — and what a systematic risk assessment of your own bedroom looks like in practice.
What the 2024 research actually shows
Two significant studies published in Frontiers in Public Health in 2024 are the most relevant for understanding the current state of the science.
The first was a randomised, double-blind, crossover pilot study conducted in Melbourne — one of the first to investigate real-world multi-night RF-EMF exposure during sleep rather than short-term laboratory simulation. Twelve healthy adults were exposed to 2.45 GHz radiofrequency from a baby monitor (or a sham device) for seven nights each in a crossover design. The study measured objective sleep outcomes including actigraphy, heart rate variability, and subjective sleep quality diaries. The active RF condition produced statistically significant changes in objective sleep measures compared to the sham condition. Ambient RF levels in participants’ bedrooms were confirmed at or below 0.02 mW/m2 — well within the range found in typical Australian homes with Wi-Fi.
The second was a large systematic review synthesising data from controlled studies on RF-EMF and sleep EEG. It found moderate-certainty evidence that pulse-modulated RF signals — the type produced by Wi-Fi routers and 4G/5G devices — produce measurable changes in EEG power in alpha, beta, delta and theta frequency bands when administered prior to or during sleep. These bands correspond to slow-wave (N3) and REM sleep architecture. The review’s key caveat: EEG changes do not automatically translate to clinically significant sleep impairment in every individual. Inter-individual variation is large and consistently documented across all published studies.
What the evidence establishes vs what it does not
Established in peer review
- Pulse-modulated RF produces measurable EEG changes during sleep
- Slow-wave and REM stages show the most consistent alteration
- Real-world multi-night exposure produces objective sleep measure changes (Melbourne 2024 RCT)
- Inter-individual variation is substantial — not everyone is equally affected
- Children with devices in bedrooms show more sleep disturbance even when devices are unused (meta-analysis of 125,198 children)
Not yet established
- Universal dose-response at typical Australian exposure levels
- Long-term health consequences from chronic low-level exposure
- Clear biological mechanism explaining inter-individual differences
- Whether EEG changes cause clinically meaningful impairment in healthy adults in low-pollution areas
The WHO classifies electromagnetic hypersensitivity (EHS) as “idiopathic environmental intolerance attributed to electromagnetic fields” — acknowledging that the symptoms reported by affected individuals are real, while controlled double-blind provocation studies have not consistently demonstrated a direct causal link to the fields themselves. This does not mean the research is settled. It means the research is ongoing and honest uncertainty is the appropriate response.
Palm Beach bedroom audit: real measurements
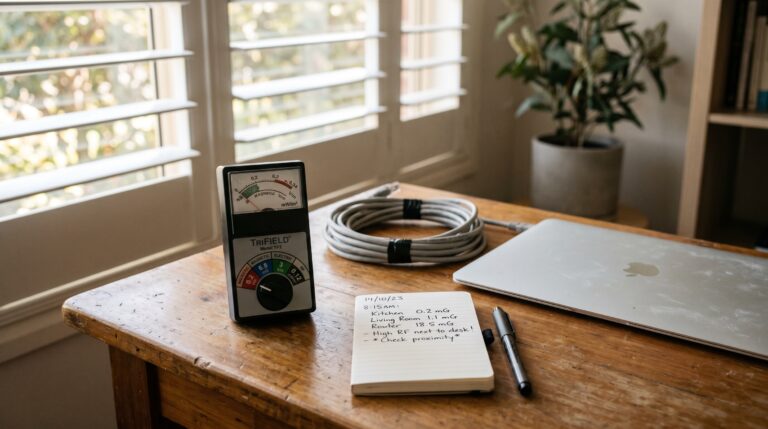
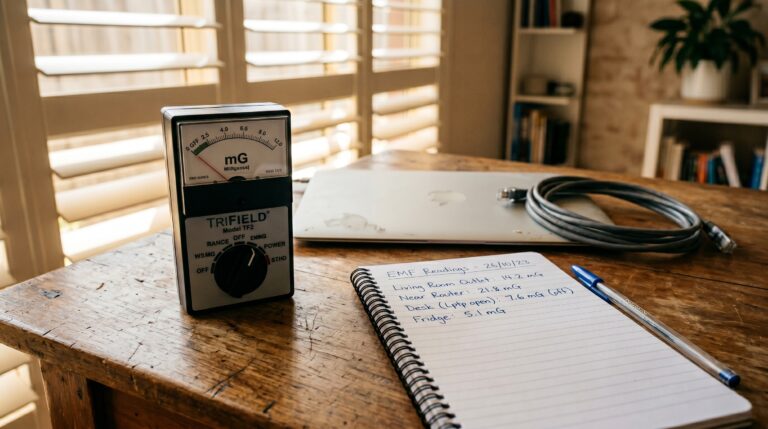
Theory is one thing. Measurement is better. Using a TriField TF2 meter — the same instrument used by building biologists for residential EMF assessments, and the ARPANSA-recommended approach for household RF measurement — I conducted a systematic audit of the Palm Beach home.
| Measurement point | RF reading | Notes |
|---|---|---|
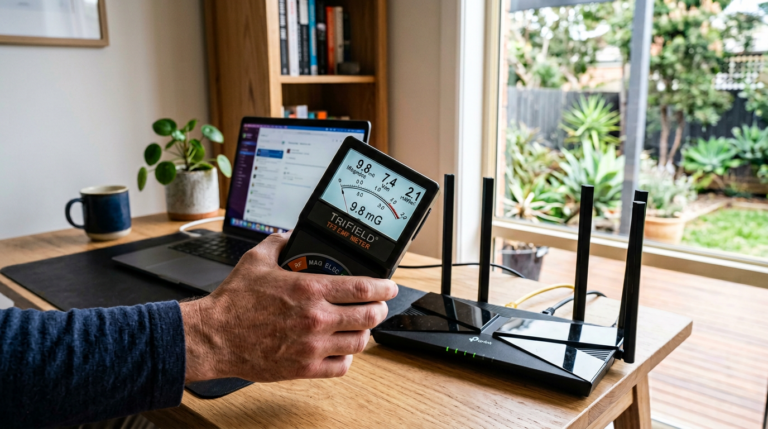
| Router — adjacent room wall (1m distance) | 3.058 mW/m2 | Before router relocation |
| Bed head — sleeping position | 0.32 mW/m2 | Before router relocation |
| Electric field at bed head (AC electric) | 93 V/m | Phone charging cable at mains — eliminated by unplugging |
| Living room — ambient background | 0.032 mW/m2 | After router moved to far end of house |
| Bed head — after router relocation | 0.032 mW/m2 | 90% reduction from 0.32 mW/m2 baseline |
ARPANSA context: The Australian regulatory limit for RF at Wi-Fi frequencies (2.4 GHz) is 10,000 mW/m2. Every reading in this audit is well below the regulatory threshold. The question the research raises is not acute safety — it is whether chronic nighttime exposure in the 0.03-3 mW/m2 range produces cumulative effects on sleep architecture in sensitive individuals. The honest answer: unresolved.
The inverse square law: RF power density drops with the square of distance. Double the distance = 75% reduction. Moving a router from 2m to 4m from the bed head reduces exposure at the bed by approximately 75% before any other measures are taken. This is the highest-leverage, zero-cost intervention.
How to measure your bedroom: the systematic approach
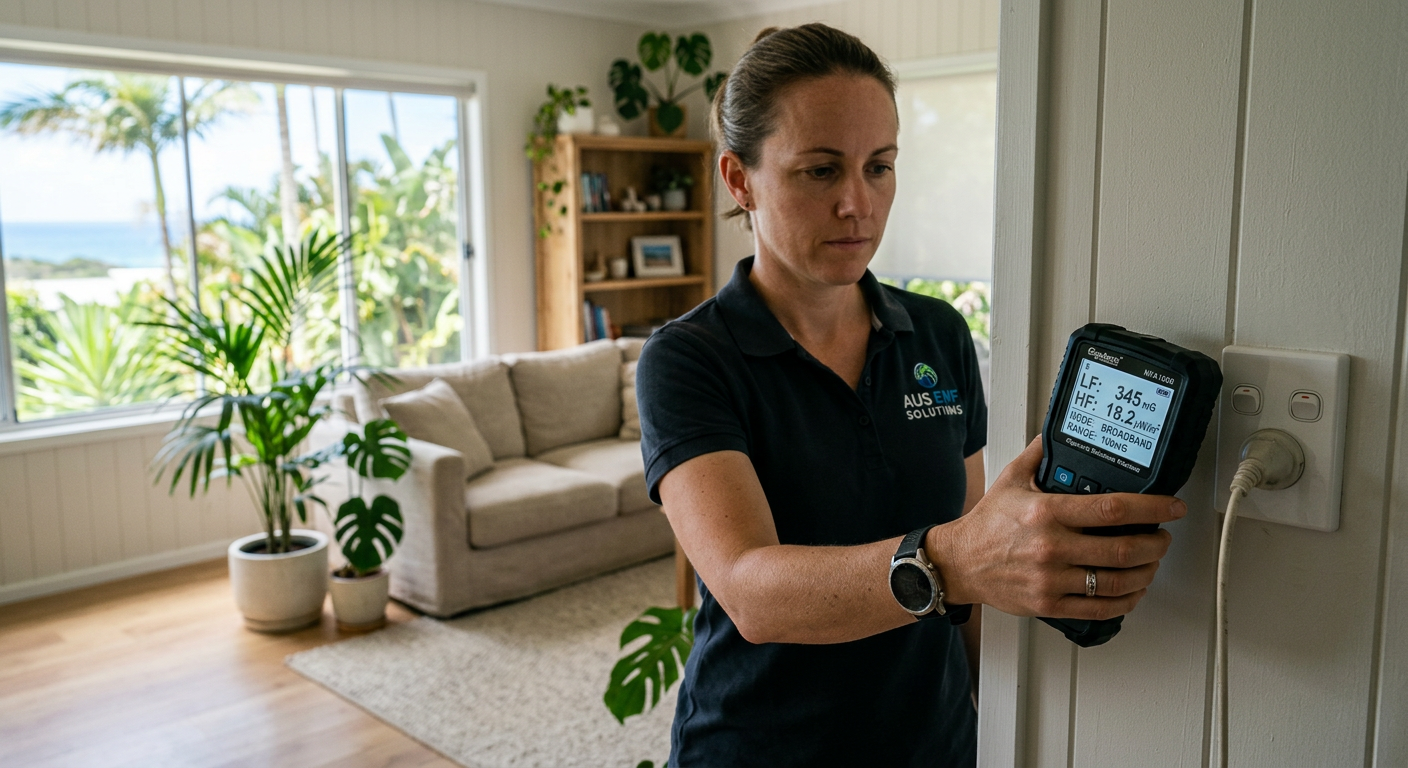
A systematic bedroom audit takes approximately 20 minutes and requires only a calibrated meter. The TriField TF2 measures RF (20 MHz to 6 GHz), AC magnetic, and AC electric in a single device — the three field types relevant to residential sleep environment assessment.
Step 1 — Establish baseline positions. Set the meter to RF mode. Take readings at: (a) the bed head at pillow height, (b) both sides of the bed at shoulder height, (c) the centre of the bed, (d) near any wall with an external-facing smart meter or switchboard. Record peak and 30-second average for each position.
Step 2 — Identify sources. Walk toward each wall and toward each device noting where readings increase. Common sources not immediately obvious: smart meter on an external bedroom wall (transmits in RF bursts throughout the night), neighbour’s router signal through a shared wall, powered-off-but-plugged-in devices in standby.
Step 3 — Switch to AC magnetic mode. Check the bed head and both sides. AC magnetic fields from high-current wiring, transformers in walls, or appliances below or above the bedroom are a separate exposure pathway to RF. Building biology precautionary guidance: below 0.1 uT in sleeping areas.
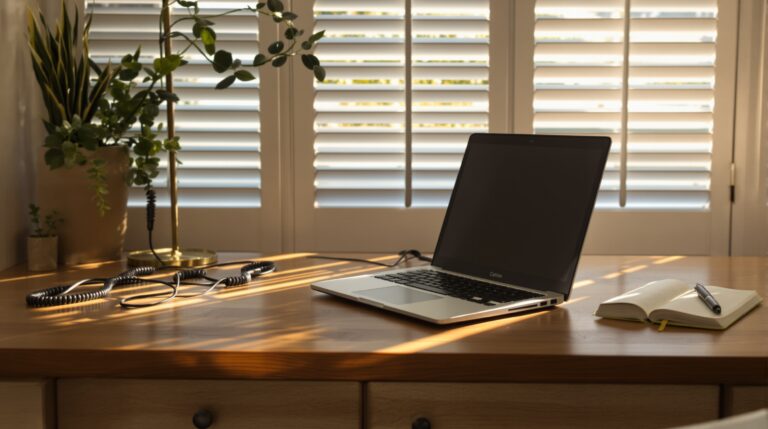
Step 4 — Check AC electric. With the meter in electric mode, check near any charging cables or power boards near the bed. The 93 V/m reading at this bed head was from a phone charging cable — eliminated entirely by charging in another room or unplugging before sleep.
Measure First. Act Second.
The TriField TF2 measures AC magnetic, AC electric, and RF fields in one meter. Without real readings, every EMF decision is a guess. Every room audit starts here.
Practical interventions in order of impact
Move router to far end of house
Inverse square law produces large reductions over small distances. Moving 3m further away reduces exposure by approximately 75%. Free.
Cost: $0 — RF reduction: up to 90% at bed head
Router off at night via smart plug timer
Eliminates the source entirely during sleep hours. A $15-25 smart plug on a timer automates this without requiring manual action. If you do not need internet access during sleep, this is the highest-confidence intervention.
Cost: $15-25 smart plug — RF reduction: 100% from router source
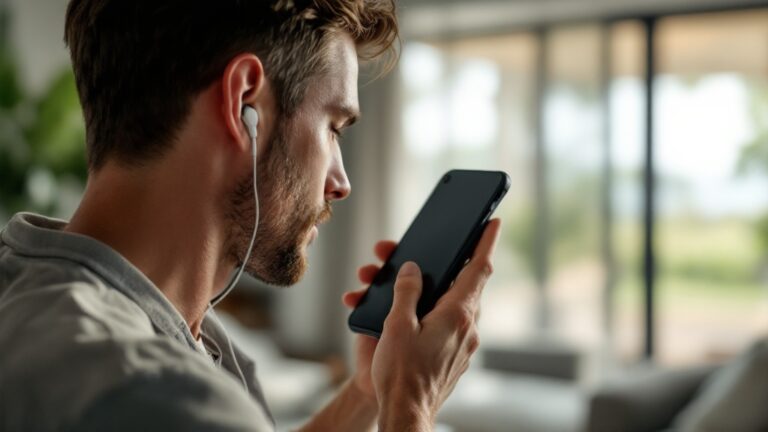
Phone in flight mode, charging in another room
Addresses both RF (active phone transmits continuously) and AC electric (93 V/m from charging cable eliminated). Mains-charged devices in standby also emit fields — unplug what you don’t need during sleep.
Cost: $0 — RF reduction: eliminates phone source entirely
Check external wall for smart meter proximity
Australian smart meters transmit on RF mesh networks throughout the day and night. If your meter box is on a bedroom wall, measure that wall. If elevated: rearrange sleeping position away from that wall, or contact your distributor about meter placement.
Cost: $0 if repositioning bed — variable for meter relocation
Frequently asked questions
Does Wi-Fi affect sleep?
A 2024 Melbourne RCT found objective sleep disruption with 2.45 GHz exposure. A systematic review found moderate-certainty EEG changes in slow-wave and REM sleep. Inter-individual variation is large. The science is developing.
What EMF level is safe for sleeping?
ARPANSA’s regulatory limit for RF at Wi-Fi frequencies is 10,000 mW/m2. Building biology precautionary guideline is below 0.1 mW/m2 for sleeping areas. Measure your own bedroom rather than assuming.
Should I turn off Wi-Fi at night?
Cost is zero. If the research holds, meaningful RF reduction during sleep. If it does not, nothing lost. A smart plug timer automates it.
What is the best EMF meter for bedroom testing?
The TriField TF2 measures RF/microwave (20 MHz to 6 GHz), AC magnetic, and AC electric fields in one device. It is the meter used for all readings in this article. For a bedroom audit, you need all three measurement modes — single-field units give an incomplete picture.
What does recent research show about RF-EMF exposure and sleep quality?
Research on Wi-Fi-frequency exposure and sleep shows mixed results across subjects. Some participants show EEG markers of disruption, others do not. Individual sensitivity varies, which is why measuring your specific bedroom matters before assuming RF is your sleep problem.
What RF levels were measured in the Palm Beach bedroom test?
Router location measured 3.058 mW/m2 on a TriField TF2. The bed head with a post-canopy setup measured 0.032 mW/m2. Distance and shielding both reduce RF significantly — measurement shows whether repositioning or barriers actually change your specific environment.
How do research exposure levels compare to ARPANSA limits?
ARPANSA’s occupational RF limit is 2 mW/m2 at 2.45 GHz. Public exposure limits are lower. Sleep studies investigating non-thermal EEG effects typically test levels well below occupational limits during chronic rest exposure.
Should I buy EMF shielding before or after measuring my bedroom?
Measure first. A basic RF meter shows actual RF levels in your space. Router relocation costs zero and often resolves the issue. Shielding fabric or canopies only make sense if measurement confirms RF is present at meaningful levels.
Get the Australian Home Environment Checklist
30 checks across water, air and EMF. Most of them free. Ranked by impact.
No spam. Unsubscribe any time.

Former Royal Australian Navy Clearance Diver and TAG-E counter-terrorism operator. Founded Clean and Native to apply the same rigorous thinking to the home environment.
Full biography →