How I Fixed My Sleep Environment: Water, Air, and EMF in My Palm Beach Home
I spent nine years in the Royal Australian Navy as a Clearance Diver. The Navy teaches you one thing above all: identify the threat before you try to solve it. You do not throw gear at a problem you have not properly assessed. When I started waking up groggy, congested, and flat every morning in my Palm Beach home — despite sleeping seven to eight hours — I did not buy a supplement or download a meditation app. I ran an audit.
Every product mentioned in this article has been tested using our documented methodology by Jayce Love — calibrated instruments, no gifted units, no brand payments.
This article is the record of that audit. What I measured, what I found, and what I changed — across water, air, and electromagnetic fields. I am not making medical claims. I am describing specific readings from calibrated instruments, the changes I made in response, and the subjective difference I noticed. Every number in this piece came from my own home, measured by me, in 2024.
If you are waking up tired and you have already ruled out the obvious — screen time, caffeine, mattress quality — the problem might be your sleep environment itself. Here is how I tested mine and what I found.
Step 1: The Water — Testing What Comes Out of the Tap in Palm Beach QLD
You might wonder what water has to do with sleep. Fair question. The connection is not dramatic, but it is real: what you drink in the four hours before bed affects hydration status overnight, which affects sleep architecture. If your water tastes off or contains residual disinfectants, you are less likely to drink enough of it. And in south-east Queensland, there is a specific disinfection fact that most people do not know.
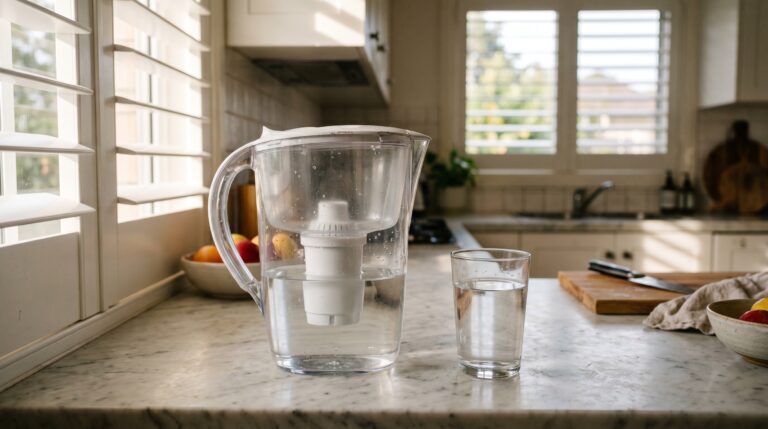
Brisbane and the entire SEQ Water grid — including the Gold Coast and Palm Beach — use chloramine, not free chlorine, as the primary disinfectant. This matters because standard carbon filters (Brita jugs, basic benchtop units, most fridge filters) remove free chlorine effectively but remove chloramine at roughly 1/40th the rate. If you have been running a Brita in Brisbane, Sydney, Adelaide, or Darwin, you have been drinking chloramine-treated water that barely touched the filter media.
I tested my Palm Beach kitchen tap with a calibrated HM Digital TDS meter. The reading: 69 ppm. Not high by Australian standards — the Australian Drinking Water Guidelines (ADWG) set a 600 mg/L aesthetic guideline for TDS — but TDS alone does not tell you what is in the water. SEQ Water’s own annual reports show the presence of chloramine residuals (target 0.5–4.0 mg/L), fluoride (dosed at 0.6–0.8 mg/L per Queensland Health mandate), and trace levels of various disinfection by-products.
My concern was not acute toxicity. It was chronic low-level exposure to chloramine and fluoride, both of which I wanted removed from my drinking water. For fluoride removal, there are exactly two effective technologies: reverse osmosis (90–97% rejection) and activated alumina (80–95%). Carbon filters — including catalytic carbon — cannot remove fluoride. I went with RO.
What I Installed: EcoHero 5-Stage Reverse Osmosis
I installed an EcoHero 5-Stage RO system under my kitchen sink. I chose it over the more commonly recommended AquaTru countertop unit because I had access to the plumbing (the house is mine, not a rental) and I wanted a permanent, plumbed-in solution with a pressurised tank.
Post-installation TDS reading: 3 ppm. That is a 95.7% reduction from the 69 ppm tap baseline. RO membranes reject chloramine, fluoride, dissolved solids, and most organic contaminants in a single pass. I added a remineralisation cartridge (the fifth stage) to restore trace calcium and magnesium — partly for taste, partly because completely demineralised water can leach minerals from your body over time.
The immediate change: I started drinking more water. Not because I forced myself to — because it tasted clean. No chloramine aftertaste, no chemical edge. I filled a 1L bottle before bed every night and actually finished it. Hydration before and during sleep improved noticeably.
I wrote a detailed review of the EcoHero system, including membrane rejection rates and annual filter costs, here: EcoHero 5-Stage RO Review — Australia 2026.
If you are in a chloramine city and still using a jug filter, that is the single highest-impact upgrade you can make for your drinking water. Read the next section before you decide though — because what I found in the air was arguably worse.
Step 2: The Air — Why My Bedroom PM2.5 Was Higher Than It Should Have Been
This one surprised me. I live in Palm Beach, 300 metres from the ocean, in a relatively new house. I assumed my indoor air quality was fine. I was wrong.
I picked up an Inkbird air quality monitor — a basic unit that measures PM2.5, temperature, and humidity in real time. I placed it on my bedside table and logged readings over five nights.
Outdoor PM2.5 in Palm Beach sits around 5–8 µg/m³ on a normal day — well below the NEPM annual exposure standard of 8 µg/m³ (the revised 2025 national standard). But my bedroom readings at night consistently showed 12–18 µg/m³, with spikes above 20 µg/m³.
The culprit was not bushfire smoke or traffic. It was my ceiling fan.
The Ceiling Fan Problem
In south-east Queensland, you run the ceiling fan most nights from September through April. It keeps air moving, reduces perceived temperature, and avoids running the air conditioner all night. But a ceiling fan in a room with any settled dust — on the fan blades themselves, on top of wardrobes, in carpet fibres — redistributes that particulate matter directly into your breathing zone while you sleep.
I cleaned the fan blades, vacuumed the room thoroughly, and re-measured. PM2.5 dropped to 8–12 µg/m³. Better, but still above the 5 µg/m³ level that the WHO revised guidelines (2021) recommend for annual mean exposure. And every time the fan ran, it stirred up whatever had settled since the last clean.
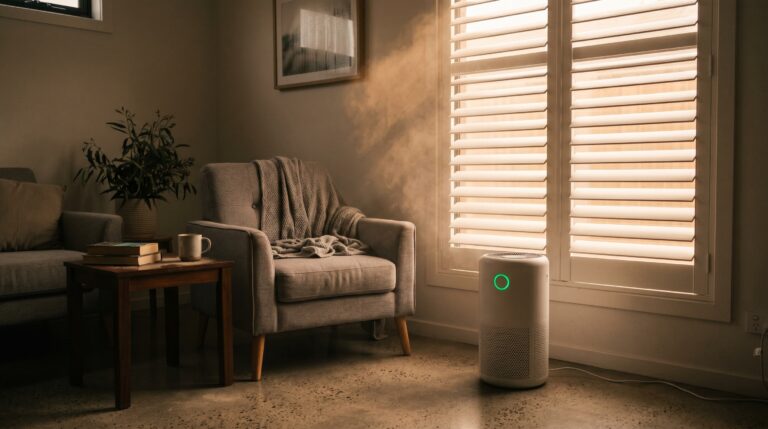
The fix was obvious: a HEPA air purifier running alongside the fan.
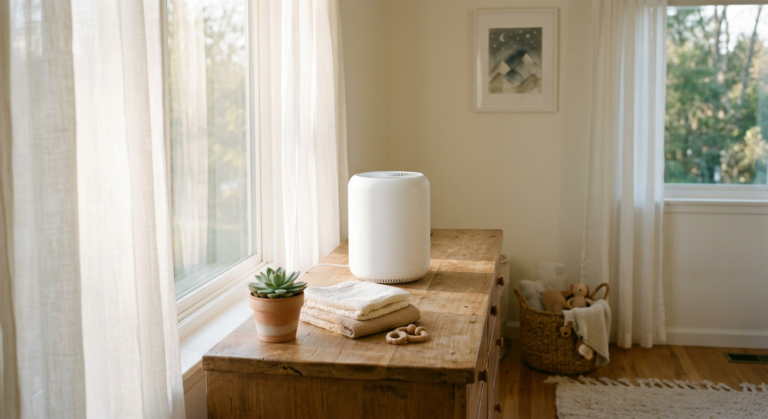
What I Installed: Levoit Core 400S
I chose the Levoit Core 400S for three reasons:
- H13 HEPA filtration: Captures 99.97% of particles at 0.3 microns — the most penetrating particle size.
- Sleep mode at 24 dB: Quieter than a whisper (30 dB). I am sensitive to noise. This was non-negotiable.
- Reasonable cost: Around $299 on Amazon AU, with replacement filters at approximately $55 every 6–8 months.
I ran it on sleep mode (lowest fan speed) every night for two weeks and logged the Inkbird readings. Average nighttime PM2.5 with the ceiling fan running and the Levoit operating: 2–4 µg/m³. That is a 70–80% reduction from the pre-purifier baseline.
The subjective result: within one week, I stopped waking up congested. That low-grade stuffiness I had accepted as normal — gone. My nose was clear in the morning. I did not need to blow my nose for the first 30 minutes of the day. It was such a simple change that I felt slightly annoyed I had not done it years earlier.
I have since tested several other units and written a detailed comparison for bedroom use: Best Air Purifier for Bedrooms — Australia 2026. The Levoit Core 400S remains my top value pick for bedrooms up to 30 m².
If you are running a ceiling fan in a Queensland bedroom without a HEPA purifier, you are breathing recirculated dust for eight hours every night. A $299 purifier and a $55 filter twice a year fixes it. That is less than $1 per night for the air you breathe during the most restorative part of your day.
Step 3: The EMF — What the TriField TF2 Found in My Bedroom
This was the section I was most sceptical about before I started. I had seen EMF discussed in contexts that ranged from credible building biology practice to outright conspiracy content. I decided to ignore the noise and just measure. Numbers do not have opinions.
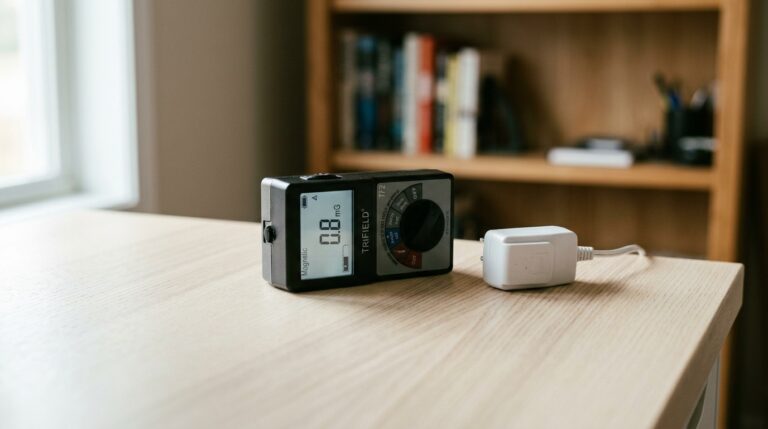
I purchased a TriField TF2 — a three-axis meter that reads RF power density (in mW/m²), AC magnetic fields (in milligauss), and AC electric fields (in V/m). It is the standard entry-level meter recommended by building biologists and the one most commonly used for home audits in Australia.
I measured my bedroom systematically: at pillow height, at each wall, near the power points, and along the floor. Here is what I found.
Finding 1: RF from the WiFi Router
My WiFi router (a standard Telstra Smart Modem) sat in the study, two rooms and one wall away from the bedroom. I assumed the signal would be negligible at that distance. The TriField TF2 showed 0.08 mW/cm² peak RF at pillow height.
For context: ARPANSA’s general public exposure limit at 2.4 GHz is 1,000 µW/cm² (1 mW/cm²) — a thermal safety limit. My reading was well under that. But the Building Biology SBM-2015 guidelines for sleeping areas recommend RF below 0.1 mW/m² — which is 0.00001 mW/cm². My bedroom was approximately 8,000 times above the Building Biology sleeping area recommendation.
Now, Building Biology guidelines are precautionary, not regulatory. ARPANSA would call my bedroom perfectly safe. But I was running an audit on sleep quality, not on regulatory compliance. The precautionary threshold exists for a reason: RF exposure during sleep has been associated with disrupted melatonin production in some peer-reviewed studies, even at sub-thermal levels. I did not need to settle the scientific debate. I just needed to reduce a controllable variable.
Finding 2: AC Magnetic Field from the Meter Box
This one was the real surprise. The external electricity meter for the house was mounted on the outside of the bedroom wall — directly behind my headboard. The TriField showed 2.1 milligauss (0.21 µT) at pillow height.
The Building Biology SBM-2015 guideline for sleeping areas is below 0.2 µT (2.0 mG) for “slight concern” and below 0.02 µT (0.2 mG) for “no concern.” My pillow was sitting right at the upper boundary. AC magnetic fields from wiring and meter boxes are not blocked by walls — they pass through most building materials. The only reliable solutions are distance or shielding with expensive mu-metal.
What I Changed
For the RF: I logged into my router’s admin panel and disabled the 5 GHz band on a nightly schedule (10 PM to 6 AM). The 5 GHz band produces higher RF power density at close range than 2.4 GHz. I also physically moved the router to the far corner of the study, adding approximately 2 metres of distance. Post-change RF at pillow height: below the TriField’s reliable detection threshold on the standard scale. Effectively negligible.
The even cheaper option — and what I recommend to anyone who asks — is a $15 plug-in timer on Amazon AU on the router power supply. WiFi off from 10 PM to 6 AM. Zero RF from the router during sleep. Combined with phone on airplane mode (free), those two actions eliminate the two largest RF sources in most Australian bedrooms.
For the magnetic field: I moved my bed 1.5 metres away from the meter-box wall. Magnetic field strength drops rapidly with distance — roughly as the inverse cube for a localised source. Post-move reading at pillow height: 0.3 mG (0.03 µT). That is a 7x reduction and well within the Building Biology “no concern” zone.
I also looked into a demand switch — a device a licensed electrician installs on your bedroom circuit breaker (around $100–150 installed). It de-energises the bedroom wiring when no load is detected, eliminating AC electric fields from the cables in your walls during sleep. I have not installed one yet, but it is on my list. For now, the bed relocation handled the dominant source.
I wrote a more detailed guide on the full audit process, including a room-by-room measurement protocol, here: EMF Bedroom Audit — How to Measure and Fix Your Sleeping Area.
The critical sequence is: measure first, reduce internal sources, then shield external sources only if needed. If your primary EMF source is inside the room (a phone on the nightstand, a baby monitor, a smart speaker), putting up shielding paint or a bed canopy will reflect those signals back at you and increase your exposure. Remove the sources first. Shielding is the last step, not the first.
The Three Tools I Actually Use
Everything I did in this article came down to three tools: a TDS meter, a TriField TF2, and an air quality monitor. You can’t fix what you haven’t measured.
What I Would Do Differently
Honesty matters more than looking smart. Here is what I got wrong or would change if I started the audit again.
I should have measured first, bought second. I purchased the EcoHero RO system before I had the TDS meter. The readings confirmed my decision, but I got lucky. If you are going to do this properly, buy the measurement tools first. A TDS meter is $20. An air quality monitor is $80–120. A TriField TF2 is around $260. Total outlay under $400 to audit all three environmental factors before you spend a cent on solutions.
I underestimated the ceiling fan’s role in air quality. I spent weeks blaming outdoor pollen and nearby construction for my morning congestion. The Inkbird monitor showed the problem was entirely indoor and entirely self-inflicted. The fan was redistributing settled dust directly into my breathing zone. Cleaning the fan blades weekly and running the HEPA purifier simultaneously was the fix. I would have caught this months earlier with the monitor.
I did not check the smart meter. My house has a standard electricity meter, not a smart meter. But many newer Gold Coast homes have smart meters that transmit data bursts at 900 MHz. These bursts are intermittent — the time-averaged RF exposure looks low, but peak readings can be 100–1,000x higher than the average. If your meter box is on a bedroom wall and it is a smart meter, measure it. The TriField’s peak-hold function will catch the transmission bursts.
I wish I had installed a demand switch from day one. The AC electric fields from bedroom wiring are invisible and present 24/7 unless the circuit is de-energised. A licensed electrician can install a demand switch on the bedroom circuit for $100–150. It automatically cuts power to the wiring when no load is drawing current (e.g., while you are sleeping with everything off). This eliminates AC electric fields from wall wiring during sleep. It is the single cheapest per-dollar EMF reduction I have not done yet.
None of these are expensive mistakes. But the sequence matters: measure, identify, fix. Not the other way around.
The Audit Checklist: Where to Start in Your Own Home
If you want to replicate what I did, here is the order I would recommend. Three questions, three actions.
The Sleep Environment Audit — Decision Tree
Question 1: What city are you in?
Brisbane, Sydney, Adelaide, Darwin → Chloramine city. Standard carbon filters will not remove it. You need catalytic carbon, carbon block, or reverse osmosis. If you also want fluoride removed, RO is the only practical option.
Melbourne, Hobart, Canberra, Townsville, Cairns → Free chlorine city. Standard carbon filters work for taste and chlorine removal. Still need RO for fluoride.
Question 2: Do you run a fan or air conditioner at night?
Yes → Measure your bedroom PM2.5 with any basic monitor. If readings exceed 5 µg/m³ with the fan running, an H13 HEPA purifier on low will bring them down. In Brisbane, Cairns, and coastal NSW, this is especially relevant from September through April.
Question 3: Where is your meter box and WiFi router relative to your bed?
If either is within 2 metres of where your head rests, measure the fields. Move the bed, move the router, or schedule the router off at night. These are free or near-free actions. A TriField TF2 gives you all three readings (RF, magnetic, electric) in one device.
The Shopping List (What I Actually Bought)
| Item | Purpose | Approx. Cost (AUD) | Where I Bought It |
|---|---|---|---|
| EcoHero 5-Stage RO | Drinking water — chloramine, fluoride, TDS removal | ~$399 | purewatersystems.com.au |
| Levoit Core 400S | Bedroom air — H13 HEPA, PM2.5 reduction | ~$299 | Amazon AU |
| TriField TF2 | EMF audit — RF, magnetic, electric fields | ~$260 | Amazon AU |
| TDS meter (HM Digital) | Water quality baseline & verification | ~$20 | Amazon AU |
| Inkbird air quality monitor | PM2.5 logging | ~$100 | Amazon AU |
| Plug-in timer | WiFi router off 10 PM–6 AM | ~$15 | Amazon AU |
Total cost for the full audit and all fixes: approximately $1,093. The two highest-impact items — the router timer and moving the bed — were $15 and free, respectively. You do not need to spend a thousand dollars. Start with measurement, and the fixes often cost very little.
The Results — What Actually Changed
I want to be precise about what I am claiming and what I am not.
What I am claiming: After making all three changes over a two-week period, I noticed subjective improvements in sleep quality. I fell asleep faster. I woke up less during the night. Morning congestion disappeared within one week of running the Levoit. I felt more alert by 7 AM than I had in months. My energy through the afternoon improved — no more 2 PM crash.
What I am not claiming: I did not run a double-blind study on myself. I changed multiple variables simultaneously. I cannot attribute any single improvement to any single change with scientific certainty. I did not measure sleep stages with polysomnography. My experience is n=1.
But the measurements are real. The before and after numbers do not lie. 69 ppm to 3 ppm. 12–18 µg/m³ to 2–4 µg/m³. 2.1 mG to 0.3 mG. Whatever caused the subjective improvements, the environmental changes are documented. That is enough for me to keep all three changes in place.
Get the Australian Home Environment Checklist
30 checks across water, air and EMF. Most of them free. Ranked by impact.
No spam. Unsubscribe any time.

Former Royal Australian Navy Clearance Diver and TAG-E counter-terrorism operator. Founded Clean and Native to apply the same rigorous thinking to the home environment.
Full biography →